
Today we would like to explain how you can track the growth of the number of visitors to your website automatically. We will use data from Matomo for this purpose. If you already use the free open source software Matomo to analyze your visitors, you can implement this how-to directly.
If your big goal is to build up an online business, sooner or later you won’t be able to avoid having your own website. To see if your website is successful, you should keep an eye on the number of your visitors. This is exactly what we want to make possible with a key figure. It should show us the number of visitors for the current month and also provide a comparison to the previous month.
Matomo (formerly Piwik)
Matomo is a widely used free open source web analytics platform and competes with Google Analytics. The software can be run either in the cloud or on its own server. The self-hosted solution makes Matomo very interesting, as it is easier to comply with data protection regulations here. After Google Analytics, Matomo is the most widely used web analytics tool in Germany. It allows accurate analysis of overall performance and user behavior, has a wide range of features and can therefore compete very well with Google Analytics.
Step by step tutorial
1. Copy token for authentication
To access data via the API, you need a token for authentication. You can get this token via the Matomo web interface. Log in to your Matomo account and navigate to the “Administration“. You can get there by clicking on the gear wheel in the upper right area of the navigation bar. Now you will find the menu item “API” in the left menu under “Platform“. Here you can copy the token under “User authentication“. Paste it into a text document, because we will need it later.
2. Copy website ID
Next we need the ID of the website you want to track. To do this, stay in the “Administration” and click in the left menu on “Manage” in the section “Websites“. You will now find your website on a card. On this card you see the ID, which you also copy into your text document.
3. Create URL
Finally we have to create the URL, with which we can load the desired data. With this url we will get the number of visitors of the current month and the number of visitors of the previous month. The URL template looks like this:
https://{matomo_url}/?module=API&method=VisitsSummary.getVisits&idSite={website_id}&period=month&date=last2&format=csv&token_auth={token}
In the URL we still need to replace the three placeholders:
{matomo_url} => the url to your Matomo installation (e.g. matomo.your-website.com)
{website_id} => enter the already copied website ID. (e.g. 1)
{token} => enter the copied authentication token here. (z.B. eb6370edda73eeffa1837ff638393ff)
The finished URL would then look like this:
https://matomo.deine-website.de/?module=API&method=VisitsSummary.getVisits&idSite=1&period=month&date=last2&format=csv&token_auth=eb6370edda73eeffa1837ff638393ff
4. Configuration of the key figure in the VINIS app
Now we have all the information to be able to create the key figure in the VINIS app. To do this, we create a new key figure for our goal and configure it as shown in the following graphic:
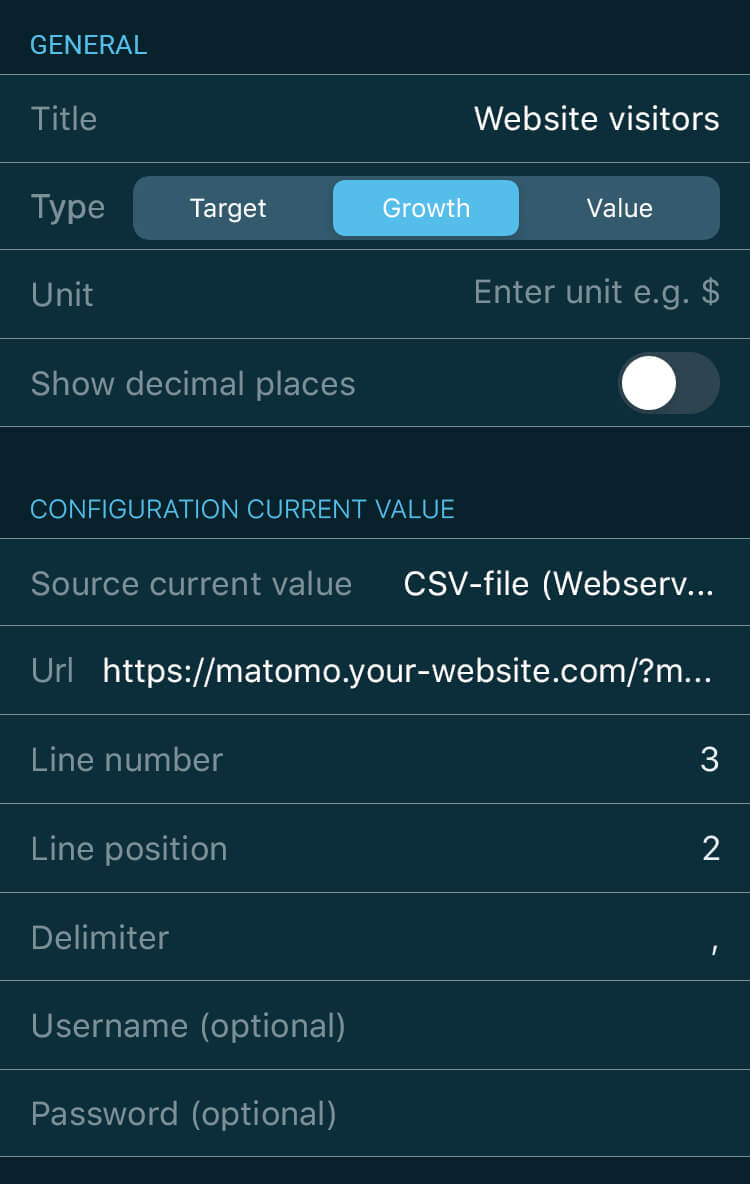
Title: Give your key figure a title of your choice (e.g. “Website visitors“).
Type: We want to show the visitors of the current month, the visitors of the previous month and the growth, or the percentage change (“Growth“)
Unit: Remains empty
Show decimal places: We disable the decimal places
Source current value: We load a “CSV file” via a web service
Url: Here we enter the already created url
Line number: 3
Line position: 2
Delimiter: ” , ” (comma)
Username: Remains empty
Password: Remains empty
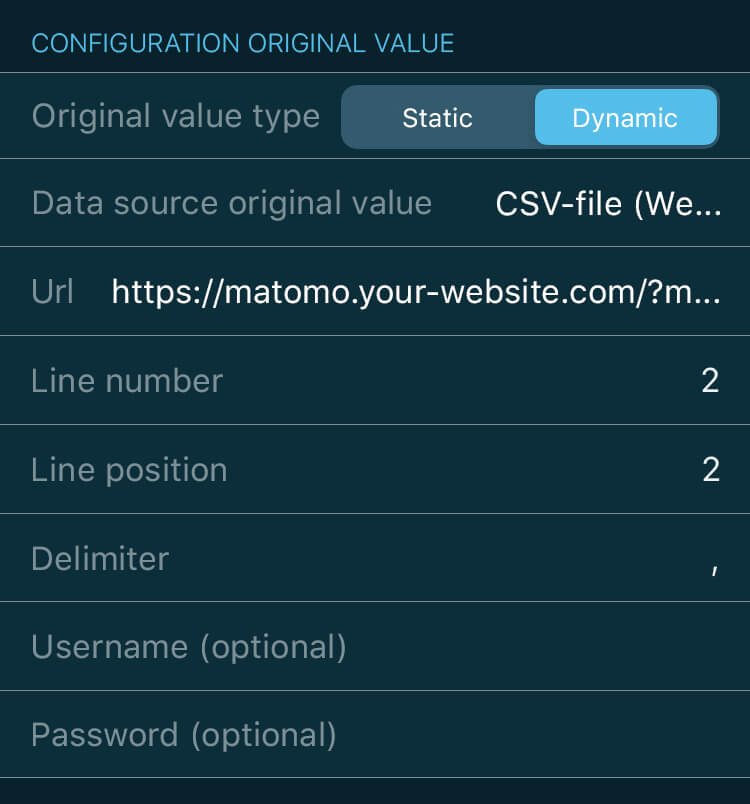
Original value type: Dynamic, because the value of the previous month changes after each elapsed month
Data source original value: We load a “CSV file” via a web service
Url: Here we enter the already created url again
Line number: 2
Line position: 2
Delimiter: ” , ” (comma)
Username: Remains empty
Password: Remains empty
In this case, the current value gives us the visitors of the current month. The original value always shows us the visitors of the previous month. So in the key figure we see these two values and the percentage change from the current month to the previous month.
With a click on “Save” we finish the configuration. Now you will receive regular updates about the number of visitors to your website. With each update, a notification informs you how many new visitors have been on the website since the last update. In the app you can track the visitors graphically via the key figure. And now have fun trying it out! Don’t have the VINIS app installed yet? Then you can download it here for free.